Overview
Social Mix
Public Space
Amenities
Connections
Final Project
Identity
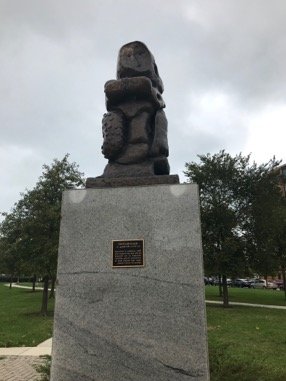
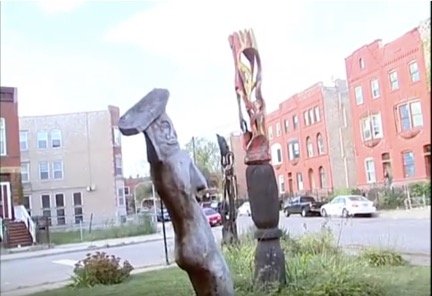
Being a primarily residential area with small commercial establishments spread throughout its borders, it is difficult for a non-resident to construct an accurate sense of Oakland’s identity. Upon arriving in the neighborhood, at Williams-Davis Park, I was greeted by a “lumpy bronze figure called Restoration” (Dukmasova). On it were the following words: "This sculpture is dedicated to the men and women who remained in the Oakland community during difficult times and worked hard to restore its former beauty" (see first picture below). I was not able to deduce the magnitude of this transformation from simply reading this message. However, a thorough historical investigation conducted after the fact was helpful in beginning to understand the nature of the cited change.
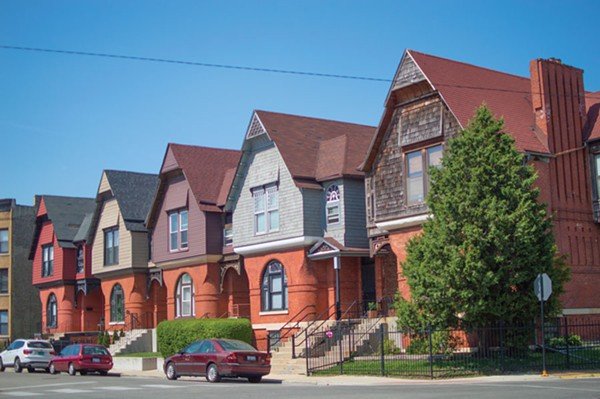
To begin to illustrate this change, this discussion will employ the use of a local case study. The 4100 block of South Berkeley Avenue in Oakland, just around the corner from the aforementioned park, plays host to a row of architecturally significant homes that were originally built for the neighborhood’s wealthiest residents in the late 1800’s (Dukmasova). As will be discussed in the last section of this assignment, the neighborhood later fell upon hard times, to the extent that by 1990, it had the “lowest family income and highest unemployment percentage” in the City of Chicago (Grossman). While it did so, “[nearby public housing complexes] lapsed into neglect and disrepair, [causing] Berkeley Avenue [to also deteriorate] in their shadow (Dukmasova). However, and this is where the sculpture’s message becomes relevant, “within a decade black homeowners' [specifically those that did not flee from the region] investment in the [South Berkeley Avenue homes] began to pay off as the projects were redeveloped into low-density mixed-income housing” (Dukmasova).
While it was not always a growing neighborhood, Oakland is currently the site of numerous new development projects, many of which are capitalizing on the area’s attractive attributes, including proximity to Lake Michigan and views of downtown (Grossman). Walking past these developments, namely the luxury condos under construction on South Ellis Avenue and East 42nd Place (see second picture below), illustrated for me the nature of the change mentioned on the sculpture. Resilience in this context is not unique to Oakland, since North Kenwood also experienced a similar deterioration and rebound. Those that currently inhabited the neighborhood, and those who did so during the turmoil, do share one unifying attribute: a commitment to the conservation of Oakland.
Works Cited
Dukmasova, Maya. "A Block in Oakland Is an Oasis, and a Tale of Segregation." Chicago Reader. Chicago Reader, 15 Oct. 2017. Web.
Grossman, Ron, and Charles Leroux. "The Unmaking of a Ghetto." Tribunedigital-chicagotribune. N.p., 29 Jan. 2006. Web.
Tolson, Claudette. "Oakland." Encyclopedia of Chicago. N.p., n.d. Web.
Size
Per Google, the size of Oakland is 383 acres. Per Social Explorer, Oakland houses around 4,878 people.
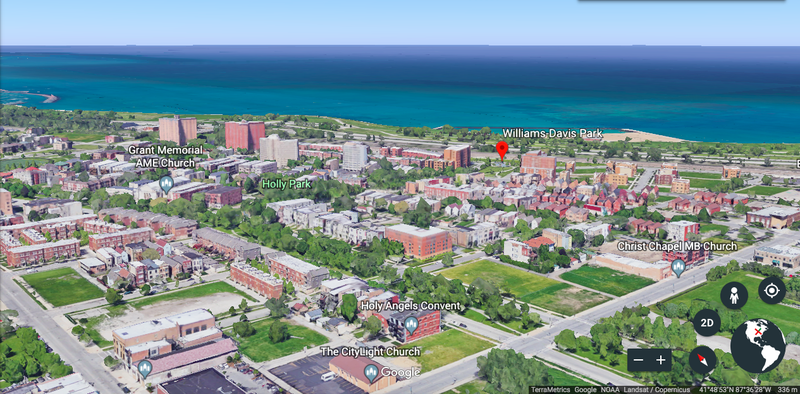
Very evenly spread out, in term of housing density, with few anomalies.
Pictures
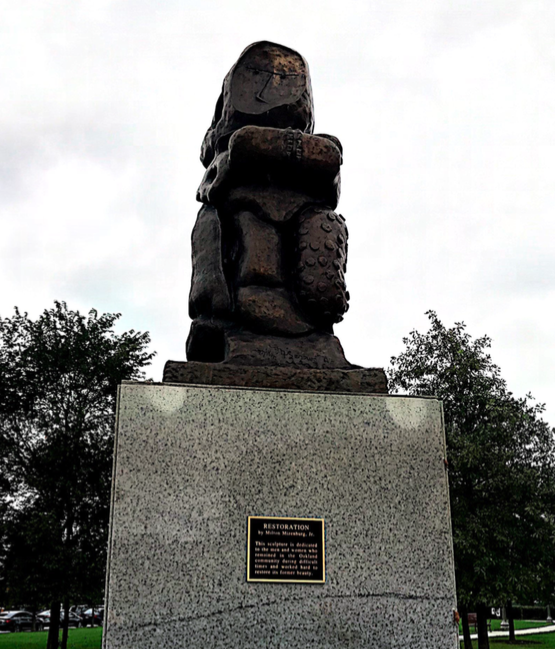
As mentioned above, the sculpture that was commemorated as a symbol of the neighborhood's rebirth.
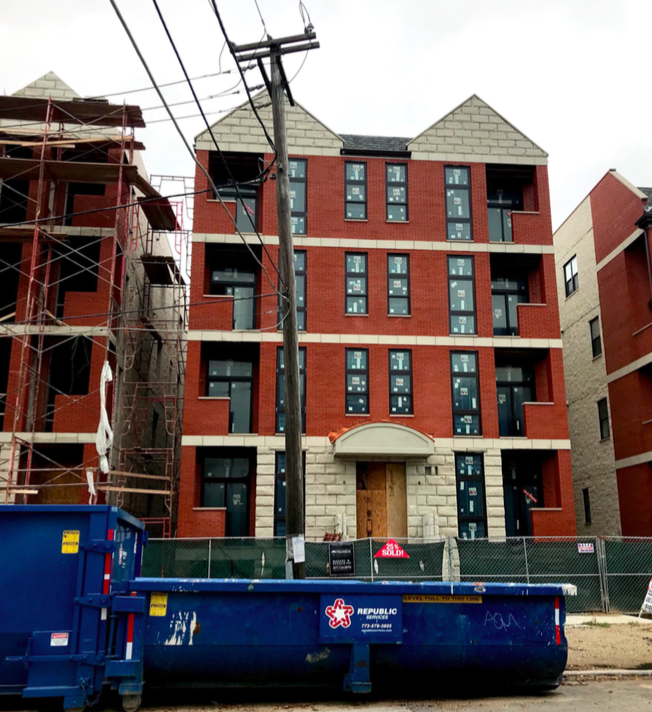
New, mid-density developments in Oakland, many of which have been pre-sold.
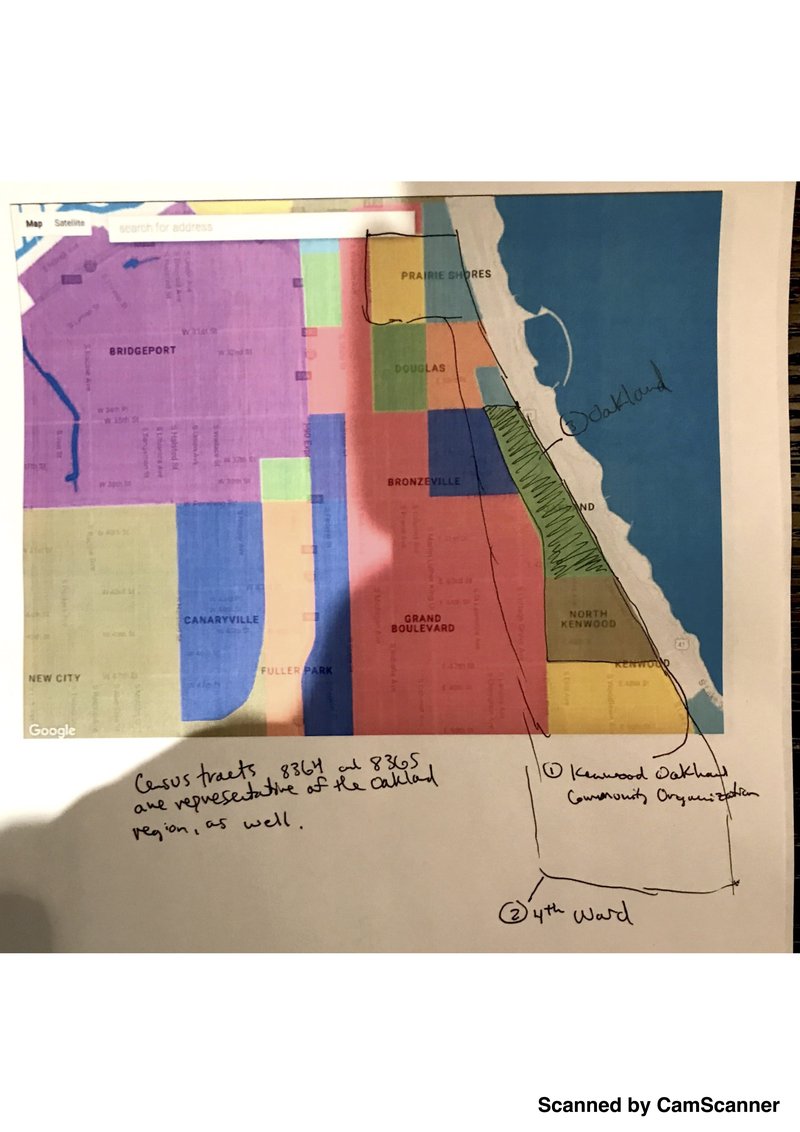
Above is a graphic denoting some of the layers of the community.
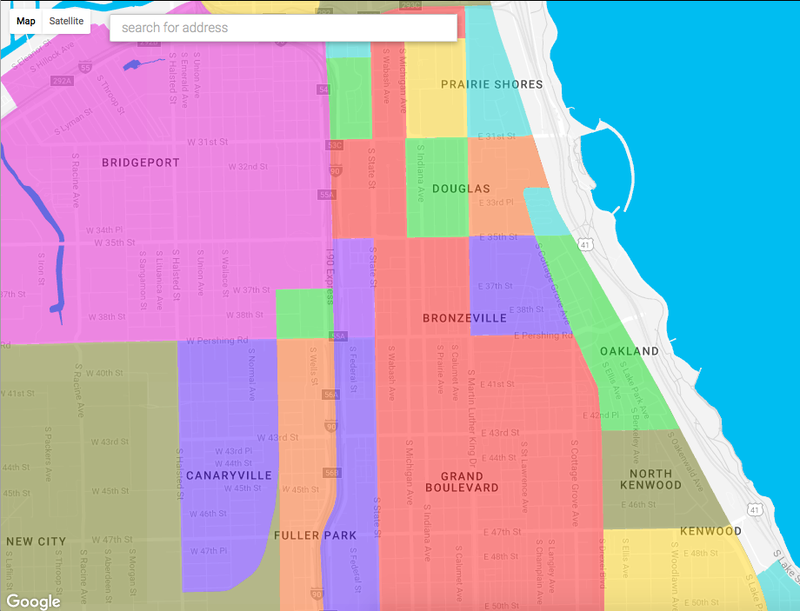
Above are officially recognized delineations for the Oakland neighborhood.
Diagram
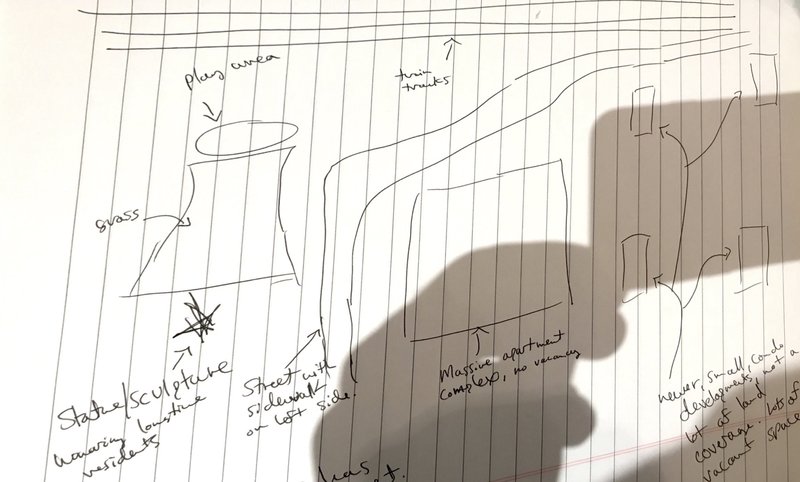
History
This overview will begin by describing the initial organization of the neighborhood. In 1851, Charles Cleaver bought 22 acres of land in the heart of the neighborhood’s modern day boundaries, and developed both a soap factory and a company town, the latter of which held worker housing, a commissary, a house of worship, and a town hall (Tolson). The region’s popularity amongst residents was grounded in “nearby Camp Douglas, the stockyards, and a commercial district that included popular saloons” (Tolson). In 1867, transportation via a horse car line was introduced (later followed by an even faster cable car), increasing the region’s accessibility to downtown (Tolson, Grossman).
While the neighborhood housed the upper echelons of society in the 1870’s, in homes “faced with stone and graced by the handiwork of artisans in marble, stained glass and copper,” its primary demographic shifted towards working-class immigrants as the 1900’s approached (Tolson, Grossman). The demographic would shift once again as time passed. In the first half of the 20th century, “African-Americans escaping overcrowded ghettos north and west…moved into rented apartments in once-stately homes [in Oakland and the surrounding area] that had been converted” (Grossman). In the second half, “more than 98 percent of Oakland had become poor and black, with people living in converted apartments, kitchenettes, crowded slum dwellings and public housing projects” (Grossman). By 1990, the neighborhood had the “lowest family income, highest unemployment percentage, [and] most families living below the poverty line” in the City of Chicago (Grossman).
To better understand this progression, its necessary to touch on the role of the Chicago Housing Authority (CHA) in the community. In the 1950’s, in reaction to the expansion of south side Chicago’s African American ghetto, “authorities turned to public housing as a way to keep blacks confined to black neighborhoods” (Grossman). The CHA’s lax screening standards led to these projects becoming “huge reservoirs of impoverished, broken families” (Grossman). In the late 1900’s, these projects were eventually demolished, because the responsible parties “increasingly saw these projects not as a solution to endemic property, but an institutionalization of it” (Grossman). This eventually led to their advocacy of mixed income housing as a replacement for the former residents of these projects (Grossman). Given that these projects had “closed off North Oakland/Kenwood on three sides,” their demolition revealed “an unlikely combination of elegant old homes and weed-choked empty lots,” bordering Lake Michigan, and privy to “dramatic views of the downtown skyline” (Grossman). These are attractive attributes that have likely driven the “galloping development and skyrocketing property values” that have come to characterize Oakland and its surrounding neighborhoods (Grossman).
Works Cited
Grossman, Ron, and Charles Leroux. "The Unmaking of a Ghetto." Tribunedigital-chicagotribune. N.p., 29 Jan. 2006. Web.
Tolson, Claudette. "Oakland." Encyclopedia of Chicago. N.p., n.d. Web.
Williams-Davis Park
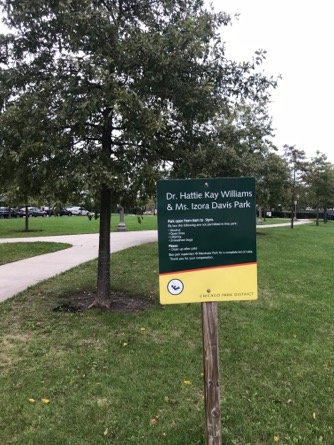
Before discussing my observations from my visit to Williams-Davis Park, it would be helpful to discuss the park’s past. Of particular note is the fact that the park was created by the Chicago Housing Authority, in association with the Chicago Park District, using land that had been previously allocated to “deteriorated public housing units” (District). Once those units were demolished, and replaced by a mixed income apartment community in 2006 (Lake Park Crescent), the landscape architecture firm, Bauer Latoza Studio, was recruited to “create an exciting public space with a playground and passive areas” (District).
Moving on to recount my observations, I will begin with a quick overview of my initial thoughts.
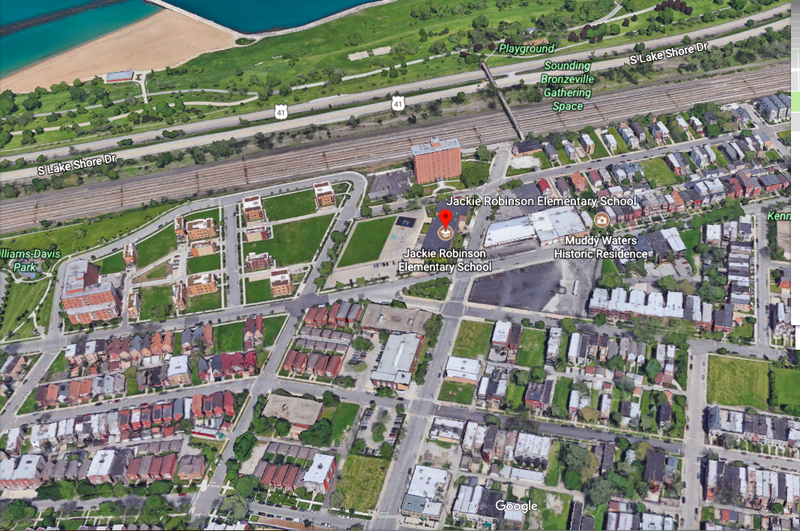
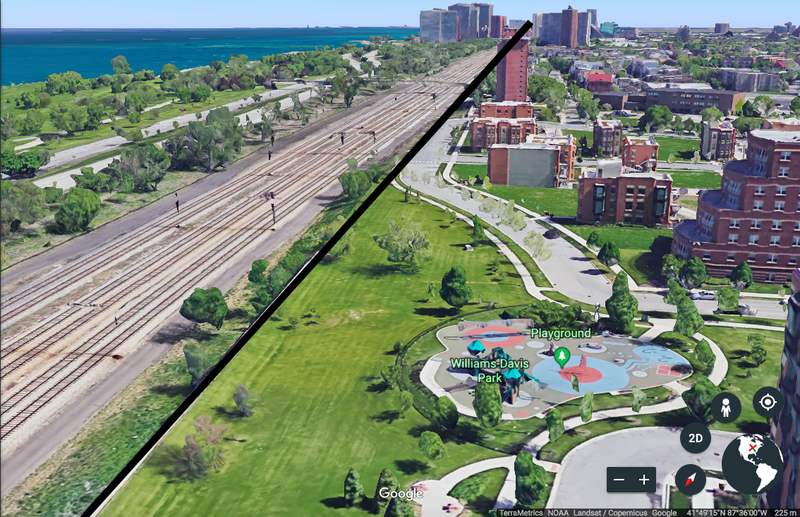
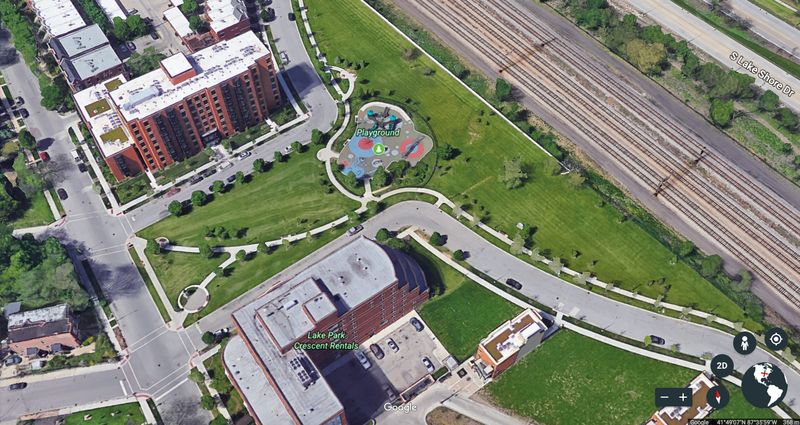
This 3D map from Google Earth is quite helpful in contextualizing the area relative to its adjacent structures. The nature of the park's location extensively affects the user experience, and will be a topic of conversation in the coming paragraphs.
There is a vast amount of well-maintained green space in the park (for sitting, playing sports, and other activities). This green area stretches an entire city block, with only a small amount of sidewalk interrupting the area’s flow (though even this sidewalk tends towards the side of the field, likely in an attempt to minimize this interruption). Strategically placed trees, along the aforementioned sidewalk, aesthetically enhance the areas. There is a playground on the eastern side of the park, near the train tracks, Lakeshore Drive, and Lake Michigan. The area is welcoming, in these regards.
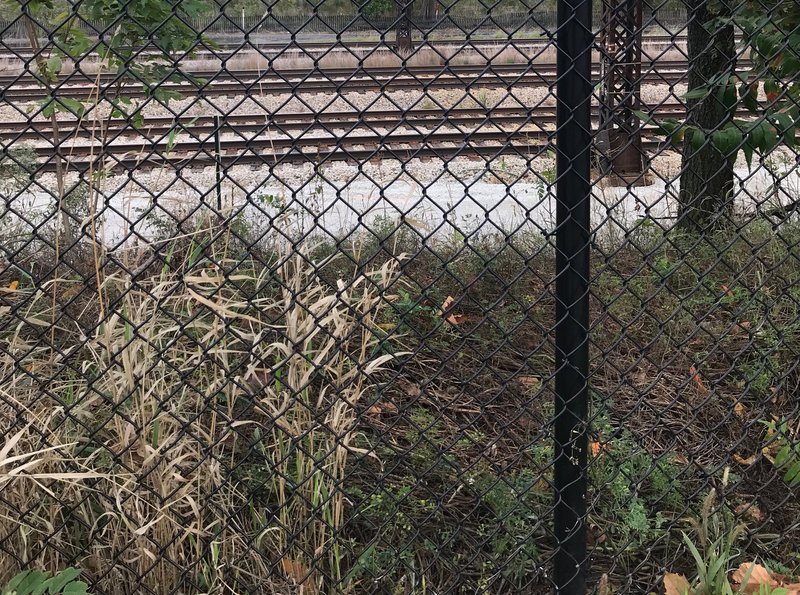
Moving beyond this overview, I will focus on the location of the park. It is situated in a residential neighborhood with newer housing stock. However, it is placed adjacent to the train tracks, which host trains that produce a disruptive amount of noise. It is also located next to Lakeshore Drive, which acts as a more consistent source of noise. These attributes could have been better shielded from the park (through specific landscape installations, etc.), but remain visible and audible. In fact, the entire adjacent area feels well connected to these two components of transportation infrastructure. As you walk away from the park, you can look beyond a fence to see the tracks (as seen in picture below).
In addition to the visibility of the tracks, there is an extensive amount of unmaintained natural plants.
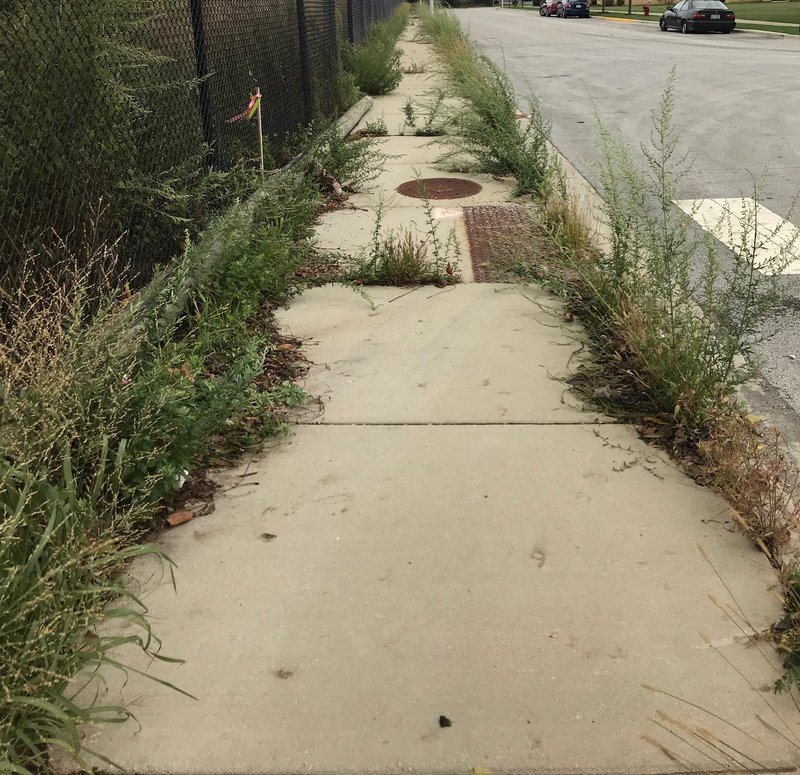
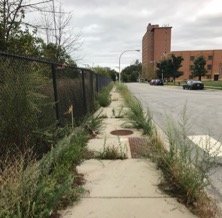
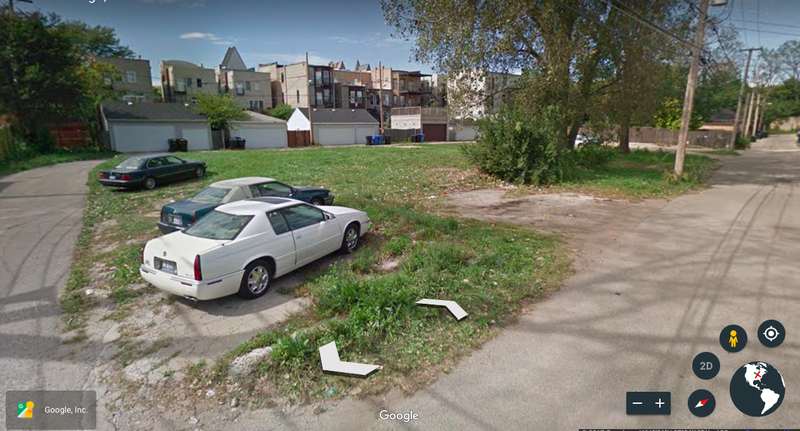
Furthermore, while the actual park seems well maintained, the sidewalks leading to the park are not (as seen in picture below).
Since sidewalks facilitate the transportation of nearby resident to the park, this would be considered a maintenance issue worth addressing.
Works Cited
District, Chicago Park. "Williams - Davis Park." Chicago Park District. Chicago Park District, n.d. Web.
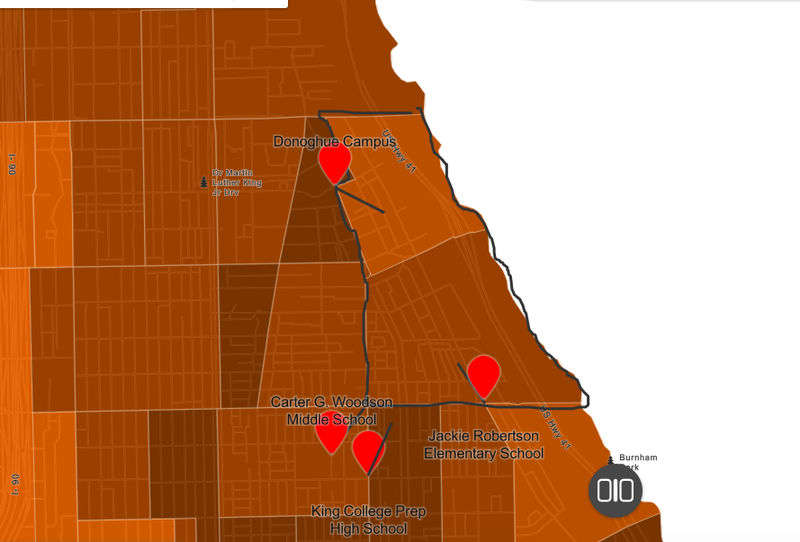
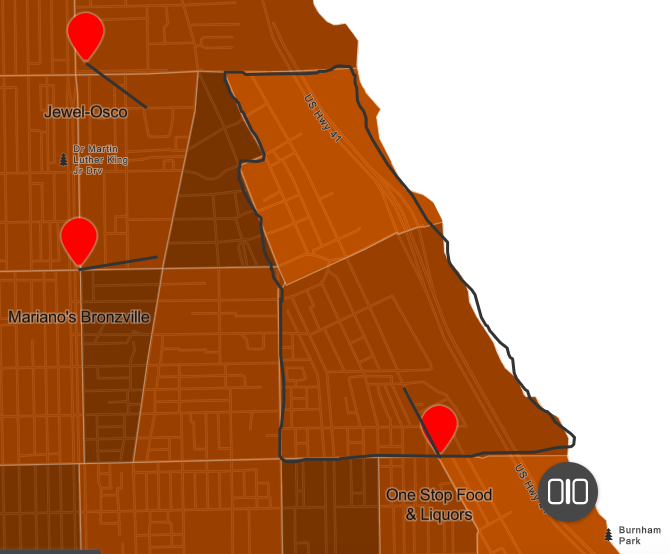
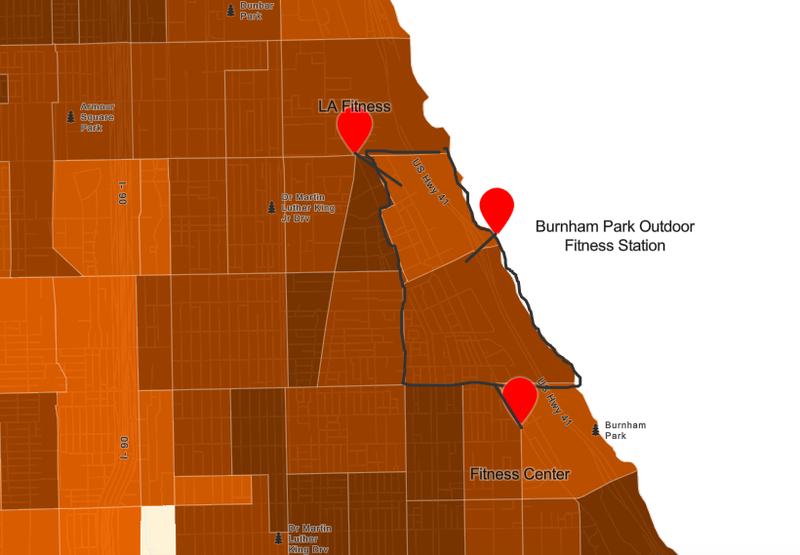
As has been documented in previous posts, Oakland is a primarily residential community. While it does play host to a fair number of community organizations (churches, hospitals, schools, etc.), it does not contain many businesses within its boundaries, a fact that impedes residents from being able to confine their existence to their neighborhood. This discussion will proceed to explore three types of institutions within, or near, the Oakland neighborhood: public schools for grades 1-12 grade, grocery stores, and fitness centers. Each category will have a map with labeled markers, for each institution in that category (with a line that denotes a 0.25-mile distance). The varying population density regions displayed on social explorer will be roughly averaged, to 9,000 people per square mile, to get a general idea of the number of residents that have walkable access to the specified facilities. Having established this number, each circle of radius 0.25 miles, shown in the diagrams below, will be understood to house 0.2 * 9,000 people = 1,800 people.
This discussion will begin on the location of schools. As seen in the map below, Jackie Robertson Elementary School lies at the southern edge of the neighborhood.
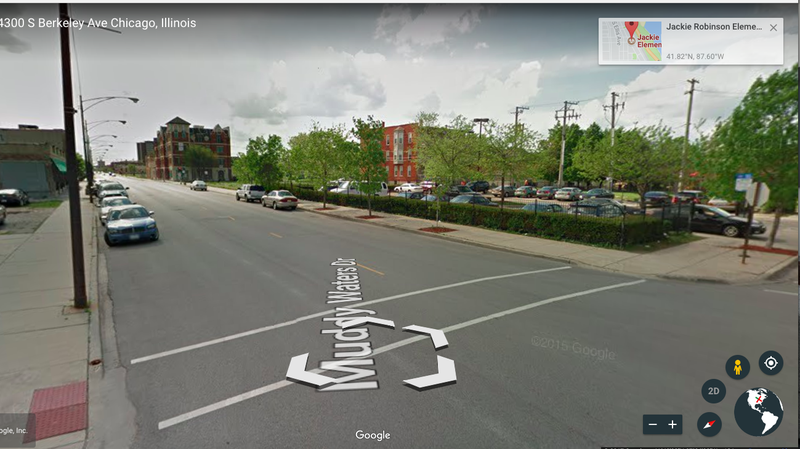
While the surrounding area is quite walkable (please see first image below), in terms of both the presence of functioning sidewalks, and some aesthetic enhancements to the route (trees and plantings, as can be seen in the second image below), the school is only within the 0.25-mile, walkable range of a small proportion of the community.
This limited range is quite problematic for schools, because they only cater to students of a certain age, so the number of people around the school that can actually make use of that particular school is much smaller than the population density of that area. The Donoghue campus, a UChicago charter school in the same neighborhood, experiences the same problem, as do the other two labeled schools. The coverage of the neighborhood, across grade levels, in terms of this walkability standard, is quite limited. This problem is experienced to a lesser extent with grocery stores, given that the number of people that make use of grocery stores in a given area is much closer, if not equivalent to, the area’s population density.
As was the case with Jackie Robertson Elementary School, One Stop Food & Liquors lies on the southern edge of the neighborhood. It is the only store that offers members of the neighborhood the opportunity to walk to a grocery store, per the aforementioned distance standard. As the map below displays, Jewel Osco (which likely has a more comprehensive selection of products) and Mariano’s Bronzeville both lie to the west of the neighborhood, and must be accessed by car.
This lack of walkable access to local grocery stores could have detrimental effects on the health of the population. Oakland’s lack of access to fitness facilities, as displayed in the map below, could also adversely affect the population. The only facility within the neighborhood is an outdoor facility, which would not be widely used in the colder months.
Note: orange colored maps taken from Social Explorer, while the street view and aerial view are taken from google earth.
Block Types
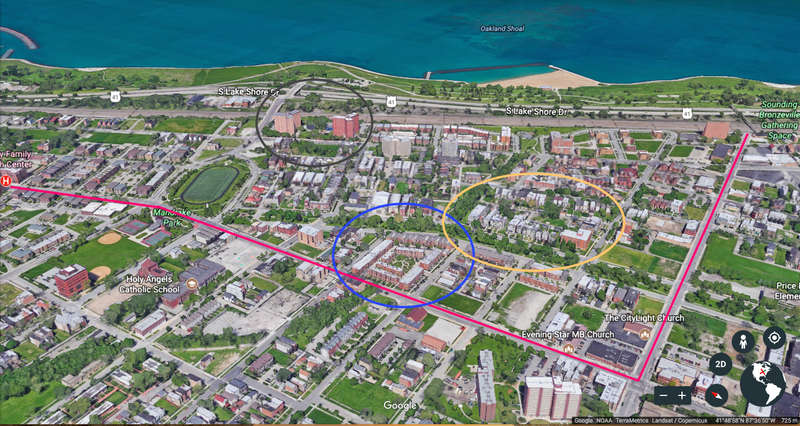
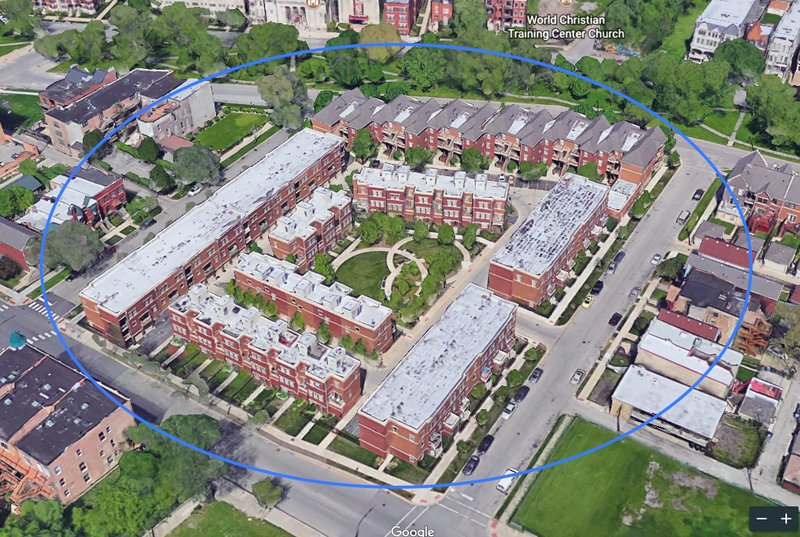
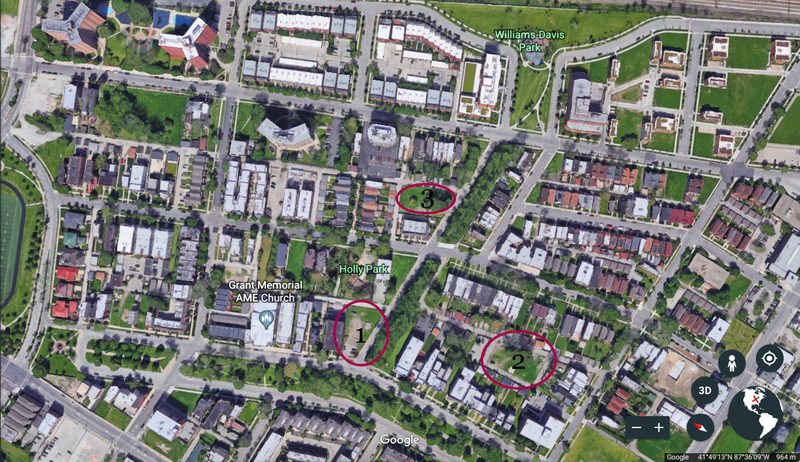
Block type varies substantially throughout the neighborhood, though these types seem to be different variations of the square block. Three have been circled, as seen in the image below (see image 1).
Image 1
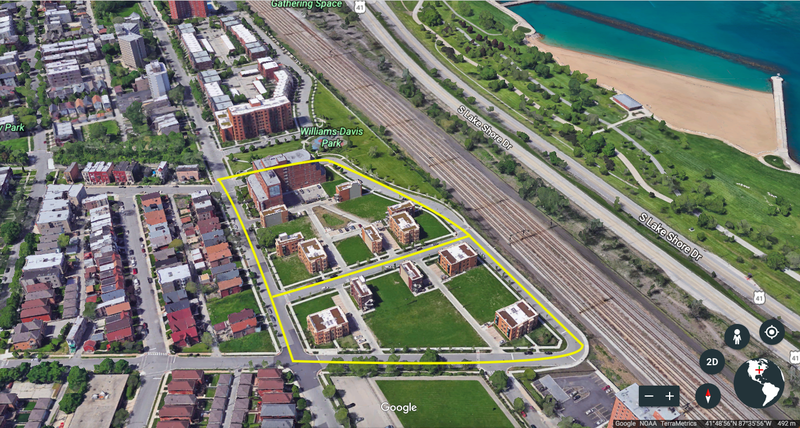
The next image depicts a variation of a square block (see image 2).
Image 2
This selected area (in blue) houses two rings of low to mid rise multi-family housing units, within which can be found a garden area for the residents. This particular development has the added benefit of standardized lot and house sizes, with meaningful circulation within the complex.
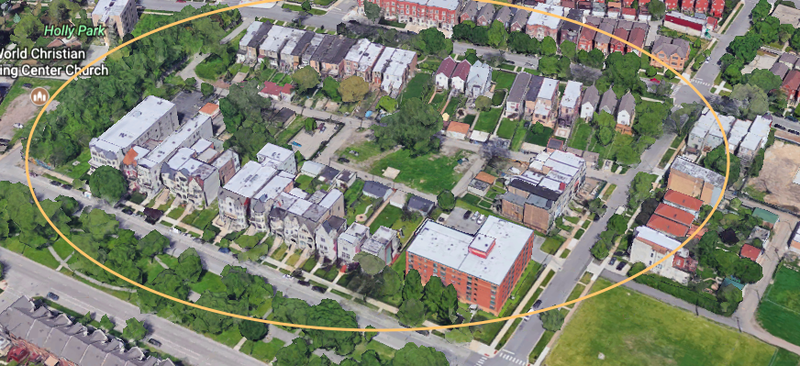
The third image depicts a another variation of a square block, comprised of primarily single family homes or town homes (see image 3).
Image 3
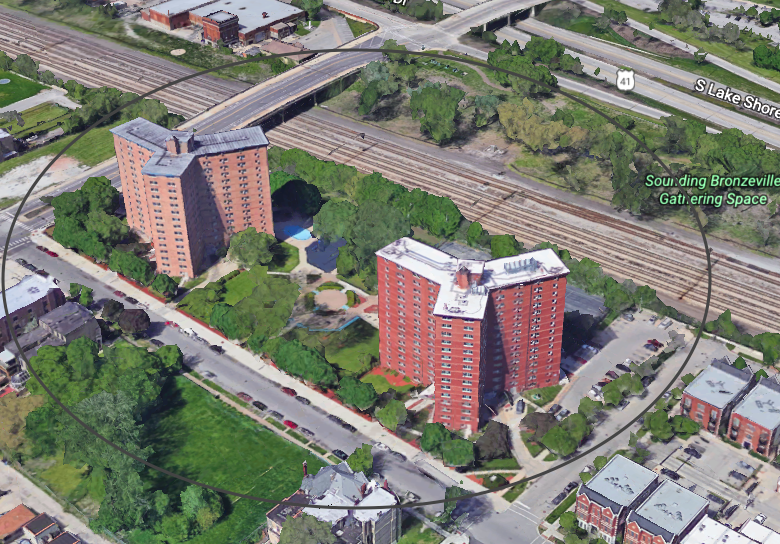
There is an unmaintained green area in the center of the complex (this could be a vacant lot, with potential for conversion to a public green space). There is also convenient access to the back of each home (the only point that strongly diverges from the square block concept). The fourth image depicts another variation of the same, though this version is composed of two adjacent high rise multi-family housing complexes (see image 4).
Image 4
There is again, a sort of green area that is enhanced with landscaping and 2 pools, between the two structures. The common presence of a contained area that can be used for gathering, recreational, and other uses, among these three selected blocks, enhances the connectivity of each of these blocks. As a result, the connectivity of the neighborhood is strengthened.
Network Types
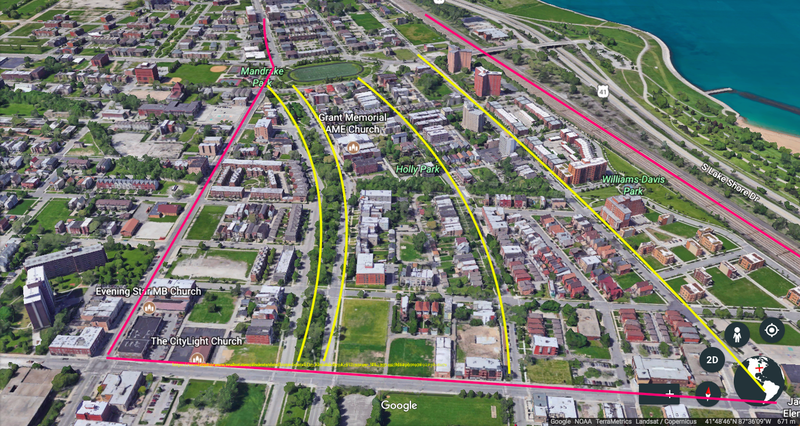
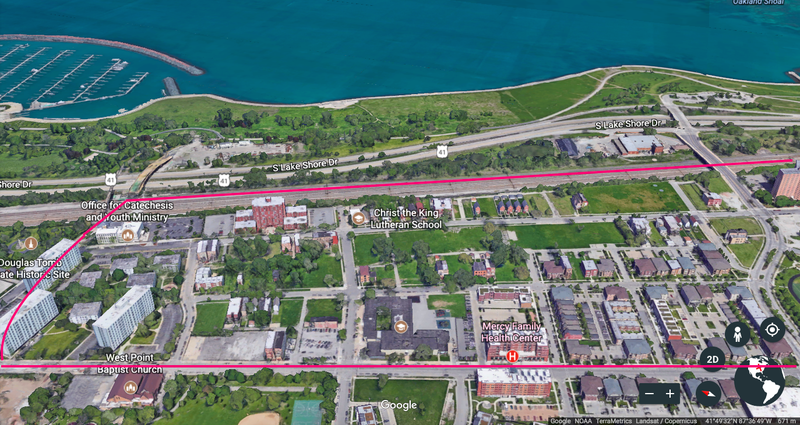
The network type seems to be best characterized as a variation of the Savannah Pattern (with influences from the Riverside Pattern). While the primary thoroughfares are not uniformly orthogonal (they are more curvilinear), there is a uniformity to these paths, in the southern section of the neighborhood especially (as denoted in pink in image 5).
Image 5
The main thoroughfares are denoted by yellow lines, and their shape and orientation counter the monotony traditionally associated with such orderly, directionally oriented paths. The northern section of the neighborhood adheres more closely to the orthogonal grid characteristic of the Savannah Pattern, particularly in that its uniformly sized streets incentivize an even distribution of traffic throughout the system (see image 6).
Image 6
Thoroughfare Types
The neighborhood is distinguished by its proximity to Lake Michigan, which also means that it is bounded by an expressway, Lakeshore Drive, on its eastern boundary. This expressway has the characteristics of a Drive, in relation to its geographical location, but is much wider. While this creates noise in the area immediately adjacent to the road, this feature also offers residents convenient accessibility to areas on both the North and South Side. While technically not a suburb, the neighborhood’s large number of empty lots, and low density multi-family developments, leave the vehicle ways best characterized as a compromise between roads and streets (see image 7). This compromise follows because of the low to moderate level of traffic, though there are developments sprinkled out throughout the area that increase population.
Image 7
Analysis
The Oakland neighborhood is primarily a residential community. Being in a city, it does have urban influences that enhance the neighborhood’s connectivity profile. First and foremost, as is recommended Victoria Transport Policy Institute, Oakland lacks cul-de-sacs (of any length) and gated communities. Even the newer housing stock, which is primarily low rise multifamily (apartments, condos and town homes), is being built in a way that embraces its geographical context, as opposed to attempting to separate itself from that very context. As discussed in the "Thoroughfare Types” section of this response, the neighborhood houses vehicle ways that are best characterized as a combination between roads and streets, and thus accommodate low to moderate vehicular speed and capacity. This fact is likely part of the reason that developers did not feel the need to separate their developments from their geographical context, given that such minimally trafficked streets are appropriate for a residential neighborhood.
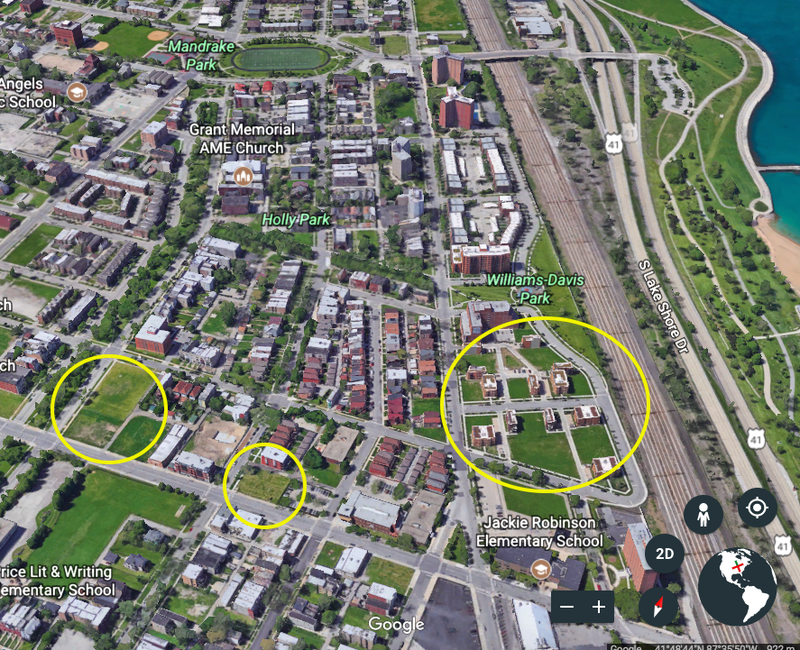
While this development has a positive effect on the city's growth, the fact that it is not making efficient use of the land is problematic, particularly when paired with the vacant lots that the city houses (present from the tearing down of older, abandoned homes, as mentioned in the introductory post). Image 8 selects a number of these uses.
Image 8: The circle on the eastern side displays inefficient use of space, while those on the west side displays vacant lots.
As discussed by Professor Talen in "Design for Social Diversity," vacant lots, particularly at city corners, detract from the vitality of intersections, and in doing so, decrease the coherence of the neighborhood. Such areas could be used to create neighborhood centers that enhance the fabric of the community. As discussed in Hess's "Pathways and artifacts: neighborhood design for physical activity," strategic landmarks (in the general sense) placed throughout the neighborhood to enhance the nature of the walking experience would encourage residents to walk through their neighborhoods more often, in turn making the area's sidewalks more vibrant. However, these vacant and underdeveloped lots diminish the quality of the walking experience.
Enliven the Park!
Per the American Planning Association, a successful public space is an “...area within the public realm that helps promote social interaction and a sense of community” (Characteristics and…). The following proposals strive to accomplish the spirit of this objective, as it relates to Oakland’s Williams-Davis Park. For introductory purposes, “[this 2.8-acre] park was constructed at a cost of $2 million… ‘[and was designed to] account for the neighborhood’s rich ethnic heritage, and established…identity as a place to celebrate art’” (Wise). The following proposals are designed to encourage the daily use of Williams-Davis Park by those within its general geographic vicinity. In striving for this objective, the park’s ability to “promote social interaction and a sense of community” will be increased.
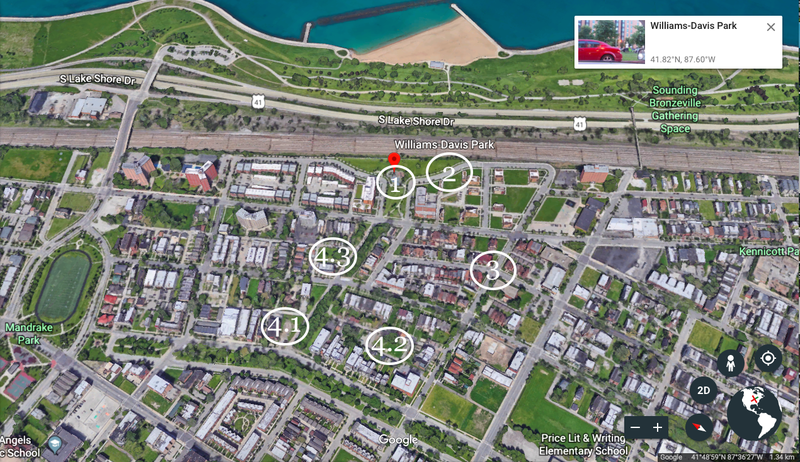
Sites of proposals. Image taken from Google Earth.
1: Side of park facing the train tracks.
2: Sidewalk to park.
3: Sample location for sign denoting architectural significance.
4.1-4.3: Sites for extension parks.
The first component of this proposal involves shielding the park’s proximity to transportation infrastructure more effectively, both for noise reduction, and aesthetic, purposes. As argued by the professionals at Hellis Arboriculture & Landscape Design, “trees reduce the perception of noise by creating a visual barrier between the source and the hearer. It has been suggested that people are less conscious of noise if they cannot see the source” (Sound Barriers…). To most effectively achieve this silencing effect, tall trees must be densely planted, as described in the images and captions below. As a suggestion that takes cost considerations into account, the Beverlyensis variety of Arborvitae would be an appropriate selection, as it can grow up to twenty feet tall and is not prohibitively expensive (Mature Size…). This suggestion is demonstrated in the pictures below.
The black line denotes the border between the infrastructure and the park. Image was taken from Google Earth, and annotated.
With the dense planting of trees (similar to trees in right graphic), at least along the stretch directly adjacent to the play area, a more effective visual and auditory barrier will be created. Image was taken from efinancial careers.
The second part of the first component of this proposal focuses on fostering appreciation for the park’s underlying design scheme, as imagined by the landscape architects at Bauer Latoza Studio. Simply put, decisions regarding the layout, orientation, and nature of the park were made with specific objectives in mind. To help local residents understand the significance of these decisions, officials can collaborate with the landscape architects to create weatherproof sign installations that articulate the theory underlying their vision. Doing so would transform the area into more of a landmark, and enhance its significance from the perspective of the nearby residents it was meant to serve. This general idea was applied to the bronze sculpture at the entrance to the park, where the artist attached a plaque that articulated the intention of his work in the context of the community’s history (this plaque was discussed in the “Overview” section).
This is an image of the bronze sculpture at the entrance of the park.
The second component of this proposal focuses on enhancing walking pathways that lead to the park. Firstly, sidewalks leading to the park from adjacent residential developments must be better maintained, to encourage recreational walking. A problematic stretch is pictured below.
This image displays a stretch of sidewalk leading to the park from a residential development directly south of the park.
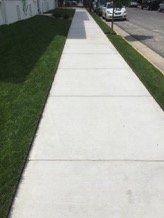
With proper landscaping maintenance, the sidewalk can look more like that in the above picture. Image taken from Concrete Works NJ.
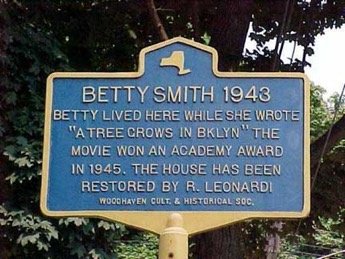
Secondly, in the spirit of integrating “artifacts” into the walker’s journey, per Hess’s “Pathways and artifacts…” text, officials could place signs at the sights of historic homes (for example, in terms of architectural significance), like in the picture below (Hess).
The idea of commemorating a significant person/structure is demonstrated through this sign. Image taken from Forgotten NY.
Doing so could help current residents connect with the neighborhood’s past, and in doing so, further a sense of neighborhood identity, all while creating another reason to walk in the area.
A sample sight that could be marked by a sign for its architectural significance is pictured above. Image is taken from Chicago Reader.
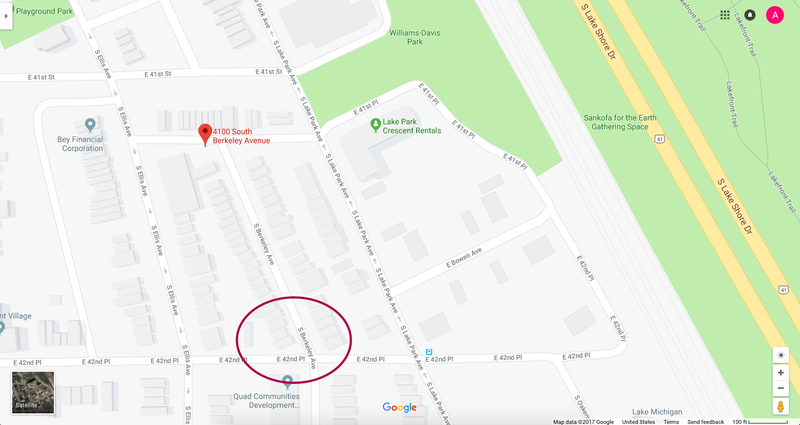
The purple circle denotes the location of these homes on the map (they are near the park). Image taken from Google Maps.
The last intervention involves extending the design created for Williams-Davis Park to selected vacant lots in the area. The intent would be to convey the essence of the initial design in more efficient ways (cost wise), with minimal assistance from Bauer Latoza Studio.
This image previews the unique placement of trees, orientation of sidewalks, and allocation of free green space in Williams Davis Park.
Doing so could encourage recreational walking (again, per Hess’s piece) and enhance the neighborhood connectivity profile. This point would especially hold if the idea was strategically applied to central plots of land, as discussed in Talen’s “Design for Social Diversity” text (Talen).
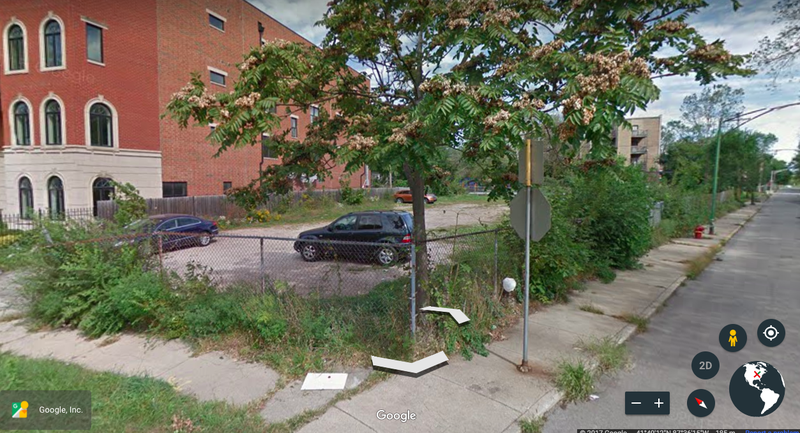
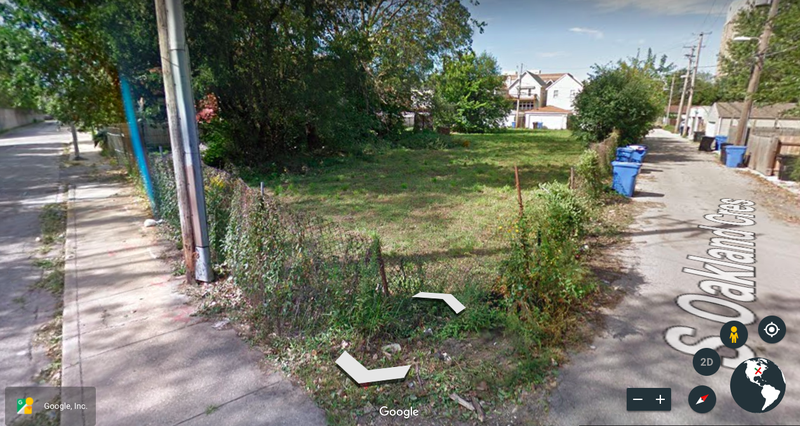
Map of the three proposed spaces. Image taken from Google Earth.
The first proposed space. Image taken from Google Earth.
The second proposed space. Image taken from Google Earth.
The third proposed space. Image taken from Google Earth.
Officials could also extend the idea of the late Milton Mizenburg Jr., who created the “Oakland Museum of Contemporary Art” by placing his pieces of art on empty lots on his street (Dukmasova). The city could look into purchasing or leasing parts of his estate’s art collection for display on these lots (or reach out to other neighborhood artists). The selected lots would be more spread out than the aforementioned installation, but would be located on the path to Williams-Davis Park, so as to encourage people to walk there.
Art from Milton’s Museum , per ChicagoRevealed.
Works Cited
“Characteristics and Guidelines of Great Public Spaces.” American Planning Association, www.planning.org/greatplaces/spaces/characteristics.htm.
Dukmasova, Maya. “A Block in Oakland Is an Oasis, and a Tale of Segregation.” Chicago Reader, Chicago Reader, 5 Dec. 2017, www.chicagoreader.com/chicago/4100-south-berkeley-avenue-oakland-south-side/BestOf?oid=27091918.
Hess, Daniel Baldwin, et al. “Pathways and Artifacts: Neighborhood Design for Physical Activity.” Journal of Urbanism: International Research on Placemaking and Urban Sustainability, vol. 6, no. 1, 2013, pp. 52–71., doi:10.1080/17549175.2013.765904.
“Mature Size of an Arborvitae.” Home Guides | SF Gate, homeguides.sfgate.com/mature-size-arborvitae-48575.html.
“Sound Barriers : The Use of Trees and Shrubs to Reduce Noise.” Hellis Tree Consultants, www.hellistreeconsultants.co.uk/page/sound-barriers-the-use-of-trees-and-shrubs-to-reduce-noise/149/.
TALEN, EMILY. DESIGN FOR SOCIAL DIVERSITY. ROUTLEDGE, 2017.
Wise, Nicholas, and Julie Clark. Urban Transformations: Geographies of Renewal and Creative Change. Routledge, 2017.
Social Mix
Assignment 2
The neighborhood of Oakland hosts very little racial diversity at the level of statistical precision. Specifically, Oakland's Simpson Diversity Index value (when calculated using the races of Non-Hispanic Black of African America, Non-Hispanic White, and Hispanic) rests at 1.16 for the year of 2016, per information compiled by Social Explorer. Per the same source, over 88% of the region’s population is “Non-Hispanic Black or African American.” The remaining 12% or so are White, Asian, Hispanic, or of another race. In comparison, the City of Chicago, boasts an index value of 2.99 when calculated across the same three races, demonstrating a near even presence of these three races within this larger geographic region.
Having discussed racial diversity, this analysis can now proceed to exploring income diversity in the region. This can be taken from income statistics, or deduced from the distribution of housing values. While there are household incomes ranging from less than $10,000 to more than $200,000, the median household income is $30,777, implying that a large percentage of these households are located towards the lower band of this range. Housing values for owner occupied units were largely in the $150,000-$300,000 range, though individuals in the lower income bands previously mentioned are typically not in the pool of home buyers, so this value must be taken with a grain of salt.
Please see below for tables of supporting data, obtained from Social Explorer.